









Product Quick Navigation
Get a Quote
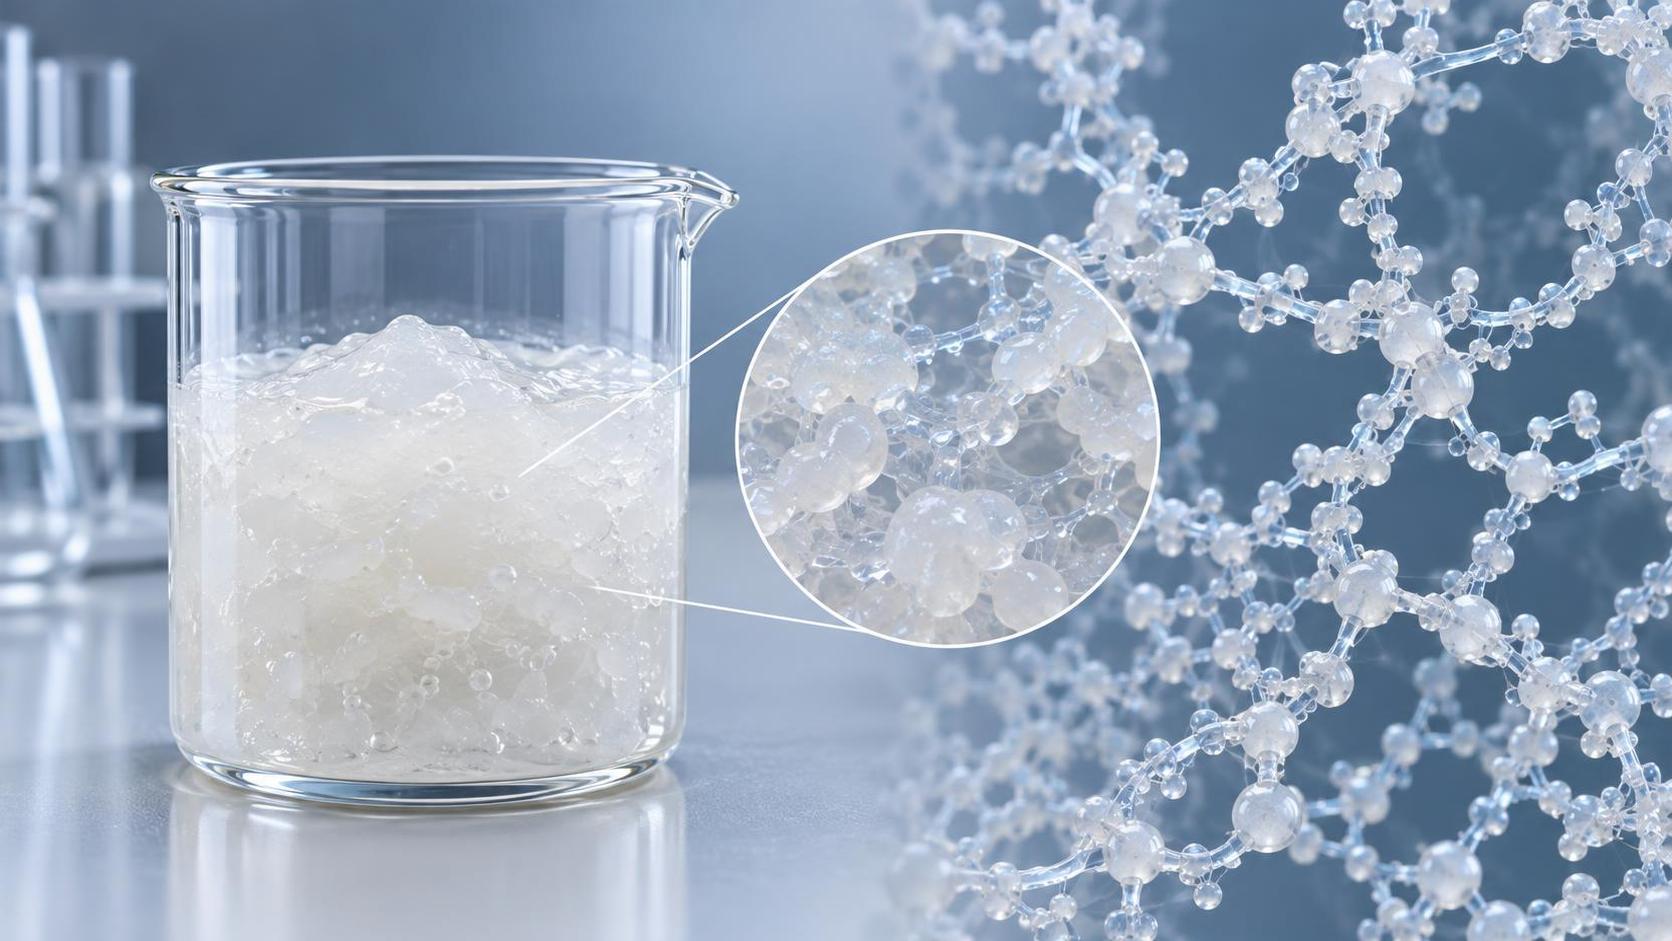
When tablet disintegration time falls outside specification—especially in fast-dissolving or immediate-release oral solid dosage forms—formulators often trace variability back to the binder or disintegrant. Modified starch for pharmaceuticals is frequently implicated, not because it’s inherently unstable, but because its functional behavior depends critically on two interrelated rheological properties: gel strength and viscosity profile. If your tablets consistently disintegrate too slowly—or unpredictably across batches—you’re likely encountering a mismatch between the starch derivative’s swelling kinetics and your formulation’s mechanical and hydration environment. This isn’t a raw material failure; it’s a functional misalignment that becomes visible only during compression and dissolution testing.
Gel strength and viscosity profile are not interchangeable metrics—and conflating them leads directly to inconsistent disintegration performance. Gel strength reflects the structural resistance of the hydrated starch network to deformation under load, while viscosity profile describes how apparent viscosity evolves over time and shear rate during water ingress. A high-gel-strength starch may form a rigid, slow-eroding barrier around granules, delaying water penetration. Conversely, a low-viscosity-profile starch may hydrate rapidly but lack cohesive integrity, causing premature granule breakdown before full tablet erosion. The critical insight for technical evaluation personnel is this: disintegration time responds more sensitively to *changes in viscosity profile slope* (e.g., rapid vs. gradual viscosity rise upon hydration) than to absolute viscosity values at a single timepoint.
How gel strength governs tablet matrix integrity during initial wetting
Gel strength determines whether the modified starch forms a continuous, load-bearing hydrogel layer upon contact with dissolution medium. Starches with high gel strength—typically cross-linked or highly substituted derivatives—swell rapidly but resist rupture, creating a physical barrier that slows water diffusion into the core. This effect is most pronounced in formulations with low porosity, high compression force, or hydrophobic APIs. In such cases, disintegration delay correlates strongly with measured Bloom gel strength (g): values above 250 g often extend disintegration beyond 15 minutes in USP Apparatus II at pH 6.8, even when other excipients remain constant.
However, gel strength alone doesn’t predict behavior across all conditions. A starch with moderate gel strength (180–220 g) but sharp viscosity onset—i.e., rapid transition from soluble to gel-state within 30 seconds of hydration—can produce faster disintegration than a higher-strength variant with delayed gel formation. That’s because early-stage viscosity rise generates internal swelling pressure before a rigid gel fully develops. Evaluators should therefore assess gel strength *in context*: test under simulated gastric or intestinal pH, and correlate with actual tablet hardness loss during early dissolution (0–2 min), not just final disintegration time.
Why viscosity profile matters more than peak viscosity
Viscosity profile—the time-dependent evolution of viscosity during hydration—is the dominant driver of disintegration kinetics in most practical formulations. Two starches with identical peak viscosity at 5 minutes may yield vastly different disintegration times if one reaches 80% of that peak within 60 seconds (steep profile), while the other takes 3 minutes (gradual profile). The steep-profile starch generates rapid internal pressure, fracturing the tablet structure before cohesive gel networks dominate. The gradual-profile starch allows time for water to penetrate deeper, enabling more uniform erosion—but risks incomplete disintegration if tablet tensile strength exceeds the swelling force.
This distinction becomes operationally critical during scale-up. Viscosity profile is sensitive to particle size distribution, moisture content (<8% w/w), and even minor variations in drying temperature during starch modification. A batch that passes standard viscosity testing at 25°C and 10 rpm may fail dissolution consistency if its profile shifts toward gradual onset under accelerated hydration conditions (e.g., 37°C, turbulent flow). Technical evaluators should request viscosity-time curves—not just single-point Brookfield readings—and validate against dissolution data using standardized paddle speed (50 rpm) and medium volume (900 mL).
Interactions that override individual parameter effects
No gel strength or viscosity profile operates in isolation. Three interactions consistently modulate their impact on disintegration:
- API surface hydrophobicity: Highly lipophilic APIs (log P > 4) reduce water penetration velocity, amplifying the barrier effect of high-gel-strength starches—even those with favorable viscosity profiles.
- Granule density and porosity: Low-porosity granules (>1.3 g/cm³ bulk density) restrict water ingress, making disintegration more dependent on starch’s ability to generate radial swelling pressure than on its dissolution rate.
- Presence of surfactants: Sodium lauryl sulfate (SLS) at ≥0.2% w/w can suppress gel network formation, effectively lowering observed gel strength and flattening viscosity profiles—potentially accelerating disintegration unexpectedly.
These interactions explain why identical starch specifications yield different disintegration outcomes across formulations. They also clarify why switching starch suppliers—even with matching DS, viscosity, and gel strength specs—often triggers dissolution failures: subtle differences in molecular weight distribution, residual catalyst levels, or particle morphology alter how the starch responds to these contextual variables.
Selecting and qualifying modified starch based on functional outcome
For technical evaluation personnel, qualification should focus on *functional equivalence*, not spec-sheet matching. Start by mapping your target disintegration window (e.g., 3–8 min for immediate-release tablets) to required starch behavior:
- If disintegration is consistently too slow (>12 min), prioritize starches with steep viscosity onset (≥70% peak viscosity reached within 90 s) and moderate gel strength (160–200 g). Avoid high-substitution ether types unless paired with high-porosity granules.
- If disintegration is erratic (RSD > 15% across six units), examine batch-to-batch viscosity profile consistency—not just average values. Request raw viscosity-time data from suppliers, not summarized tables.
- If disintegration fails only under acidic conditions (pH 1.2), suspect acid-labile cross-links. Prefer phosphorylated or hydroxypropylated starches over cross-linked variants for gastric-resistant applications.
Huafeng Chemical’s compliant modified starch portfolio includes variants engineered for predictable viscosity onset and controlled gel strength ranges—designed specifically for global pharmaceutical supply chains where regulatory documentation, lot-to-lot consistency, and stability across storage conditions are non-negotiable. Their technical support provides viscosity-time curves, pH-dependent gel strength data, and dissolution correlation reports—not just CoA sheets—enabling direct functional assessment without additional in-house characterization.
Practical verification steps before full-scale adoption
Before committing to a new modified starch, conduct these three targeted tests:
- Measure disintegration time in triplicate using your exact tablet composition, compression force, and dissolution apparatus—no substitutions.
- Run parallel viscosity profiling: suspend 5% w/w starch in dissolution medium at 37°C, record viscosity every 15 s for 5 min using a rotational rheometer (0.5 Pa·s torque threshold).
- Correlate time-to-50% peak viscosity with time-to-50% tablet mass loss in dissolution. A correlation coefficient (r²) < 0.85 indicates other factors dominate; revisit granule porosity or API wettability.
Disintegration time isn’t dictated solely by the starch—it’s the emergent result of how that starch behaves *within your system*. Gel strength sets the upper limit of structural resistance; viscosity profile determines the timing and distribution of swelling force. When both align with your tablet’s physical architecture and dissolution environment, consistency follows. When they don’t, variability emerges—not from manufacturing error, but from unaddressed rheological mismatch.
Send Us Your Inquiry Today
